RSI Indicator: how to use and correctly apply in trading?
The Relative Strength Index (RSI) is a convenient tool that allows you to identify a necessary correlation based on a specific formula, which helps simplify the process of technical analysis.
Indicators are undoubtedly useful, but in moderation. Therefore, it is not advisable to mix various analysis tools together, turning the chart into a mess. Use only well-established indicators within a proper analysis system.
RSI Description
RSI represents a line formed by calculating the relative difference between the closing prices of candles over a selected period, based on moving averages.
The distinctive feature of the RSI indicator is the oscillation of its values within the range of 0 to 100, which categorizes it as an oscillator.
The formula for calculating RSI is as follows:
RSI = 100 - 100 / RS_ratio, where
RS_ratio = average value of all positively closed candles over N period / average value of all negatively closed candles over N period.
The RSI indicator has:
- A signal line formed over a selected N period. In the case of a significant price increase, the signal line tends to approach the 100 mark, while in the case of a decrease, it approaches 0.
- A confidence range at certain levels of the percentage scale of the oscillator. When the signal line exceeds this range, it indicates that the price is in the overbought/oversold zone.
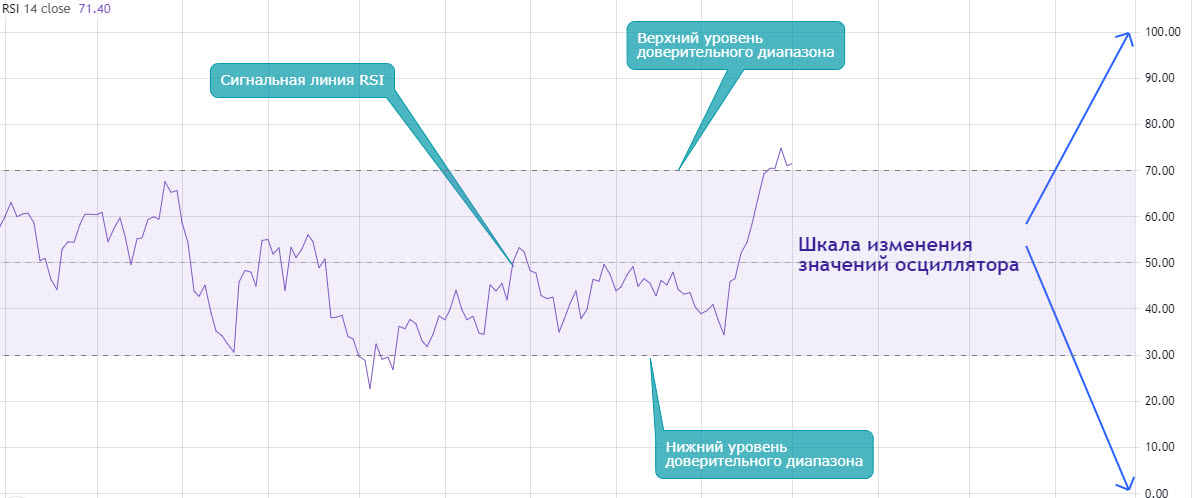
In fact, RSI takes historical data over an N period, expressed in the number of candles of the selected chart timeframe, and transforms them into a form that allows judging the current trend, market sentiment, as well as determining overbought and oversold zones.
Optimal RSI Settings
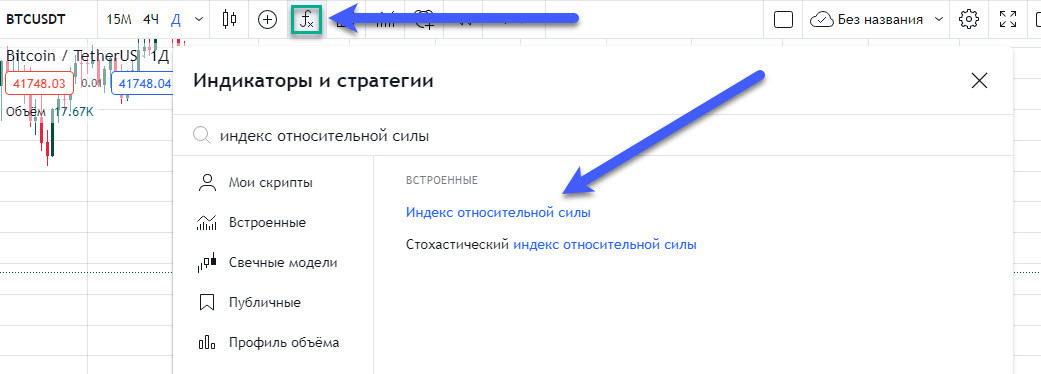
To display the considered indicator on your chart in TradingView, go to the "Indicators and Strategies" section and enter "Relative Strength Index" in the search bar:
You can easily modify all the indicator settings by clicking on the "gear" icon:
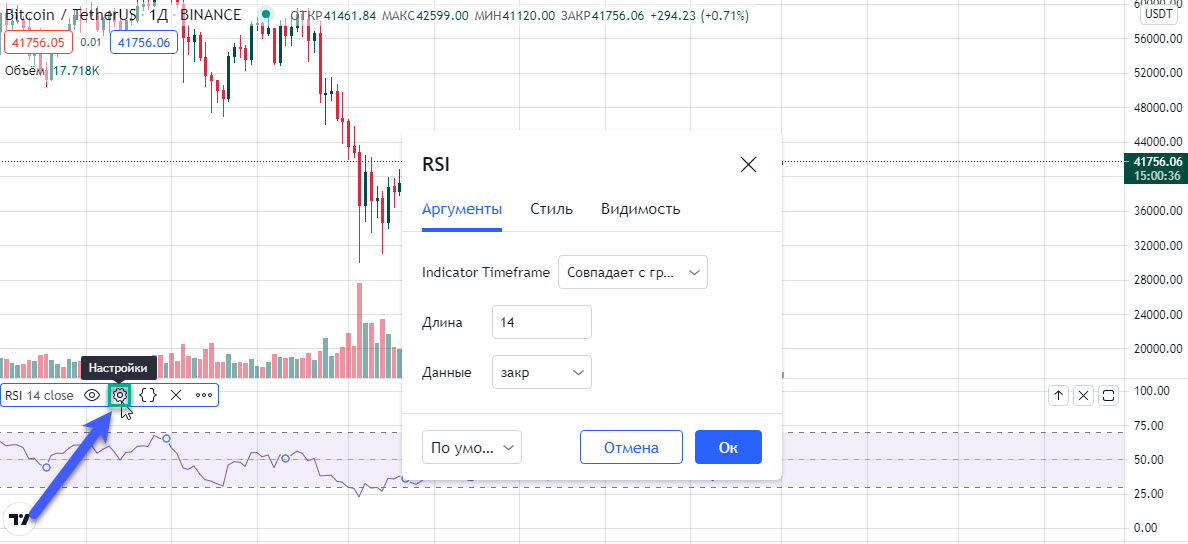
In the Indicator Timeframe section, you determine the timeframe used for calculating the values. By default, the parameter is set to "Same as Chart." I recommend leaving it unchanged since when switching between timeframes, you should evaluate the local situation based on RSI within the time frame of the considered chart candle.
The Length and Data parameters define the calculation parameters of the RSI signal line. The default parameters are suitable for trading, and I do not recommend changing them. Additionally, you can customize the design of the main oscillator components in various ways.
Proper Use of the RSI Indicator
When the price is in the overbought zone, it can be concluded that the relative length of green candles is decreasing, indicating a weakening bullish momentum and an imminent correction. Similar observations can be made with red candles when the price enters the oversold zone.
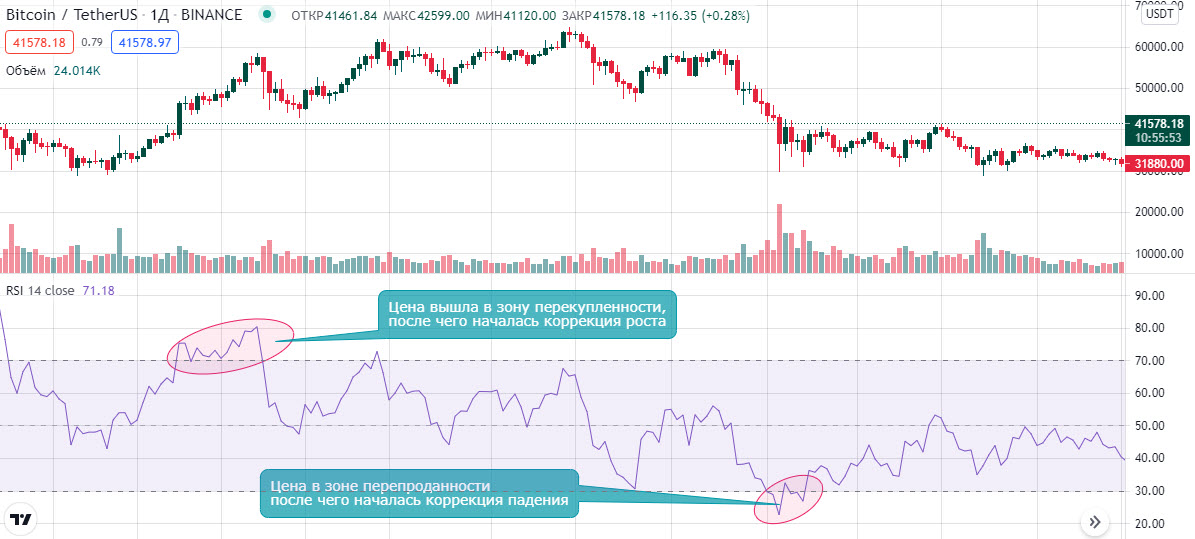
It is worth noting that the RSI signal line can remain in the overbought or oversold zone for an extended period without a rapid price correction!
Therefore, this signal is only a warning and should not be taken literally. To reduce the number of false signals during a strongly bullish trend, you can set the confidence range to 40/80, and during a bearish trend, to 20/60.
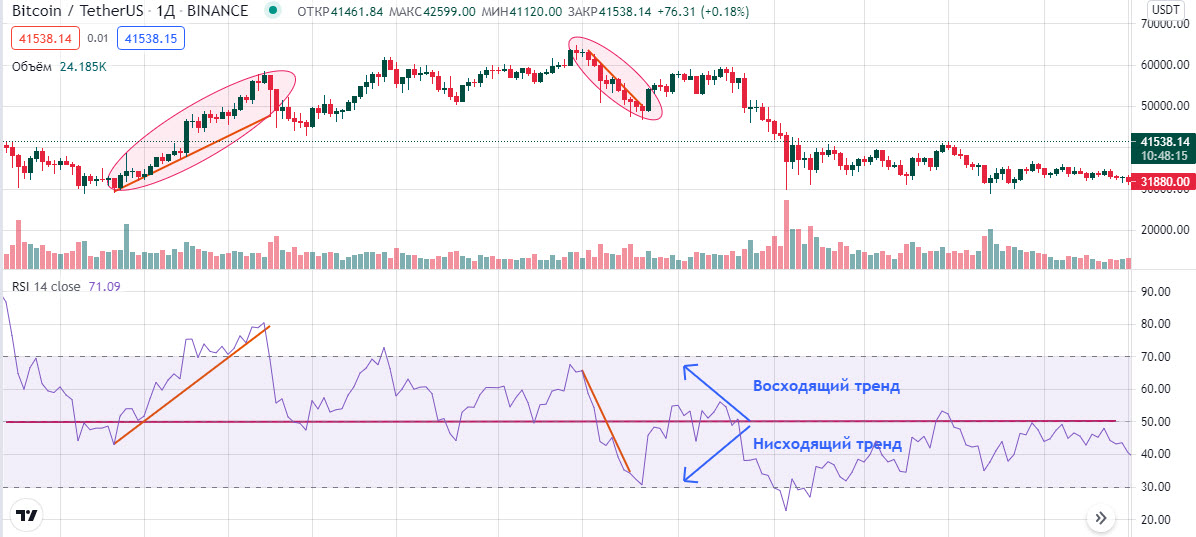
It is also important to pay attention to the middle of the range, namely the 50% level. When the signal line is above this level, there is a strong bullish trend, and when it is below 50%, there is a bearish trend.
Conclusion
Let's summarize:
- The Relative Strength Index (RSI) is an interesting, simple, and reliable indicator that conveniently allows you to assess the characteristics of the current movement;
- The indicator is an oscillator since its values are expressed in percentages;
- The main components of the RSI indicator are the signal line and confidence range levels;
- When the signal line exceeds the upper level of the range, the price is in the overbought zone;
- When the signal line drops below the lower level of the range, the price is in the oversold zone;
- If the signal line is above the 50% level, you are observing a strong bullish trend;
- When the signal line fluctuates below the 50% level, the trend on the coin is bearish;
- RSI signals should be confirmed by other graphical analysis tools.