Timeframe - what is it on the charts?
There are six main periods for price charting:
- M (minute): 1M (1 minute), 5M (5 minutes), 15M (15 minutes);
- H (hour): 1H (1 hour), 4H (4 hours);
- D or D1 (1 day);
- W, W1, or Wk (1 week);
- MN or Mo (1 month);
- Y or T1 (1 year).
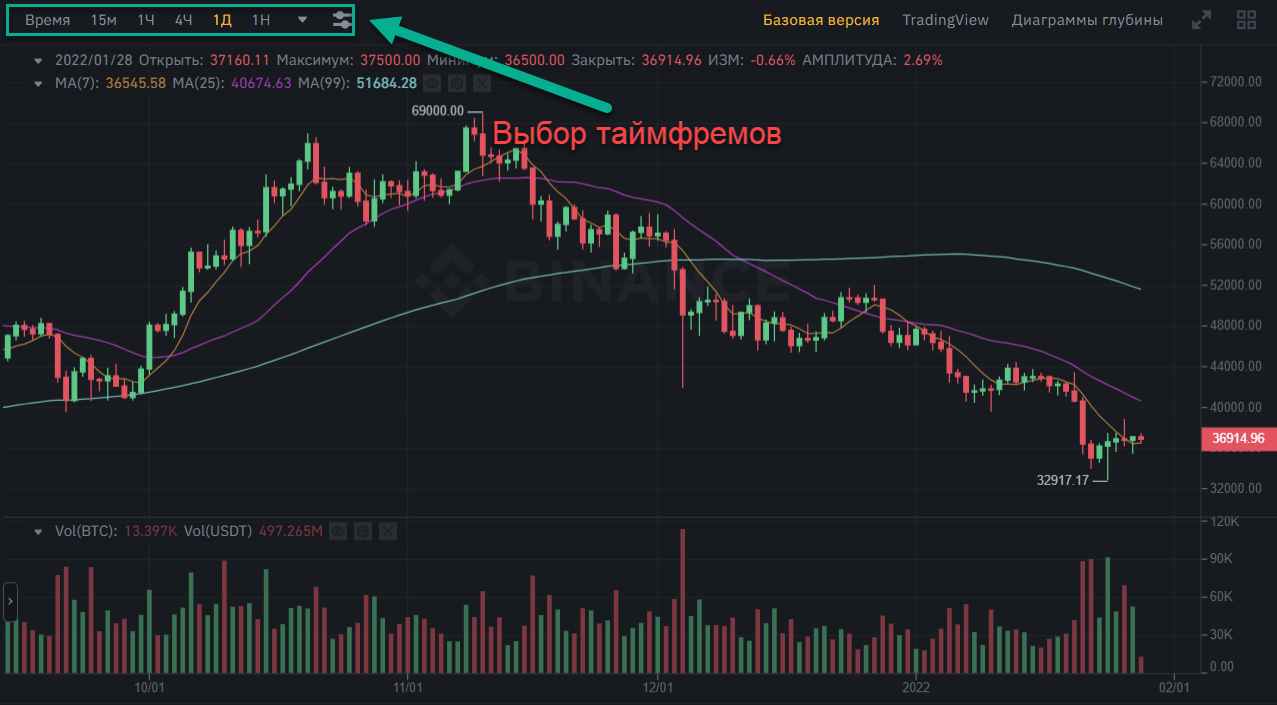
The size of bars and candles depends on the selected timeframe. For example, if the chart is based on the 1H period, each candle or bar will represent the price dynamics for 1 hour. In the case of Mo, this period will increase to 1 month (i.e., each candle represents one month), and so on.
The timeframe selection panel is usually located in the top right corner of the exchange terminal or TradingView window:

Which Timeframes to Use?
The choice of timeframe is individual and depends on the trading tactics, the strategy used, and personal preferences. Working with charts of longer timeframes is relevant when analyzing long-term trends. It allows you to review price changes over an extended period of time, such as a month, six months, or a year. The results obtained can be used to analyze market development from a long-term perspective.
A significant advantage of longer-term charts is the absence of false movements. The minimal amount of "noise" helps to more accurately determine the main trend lines and resistance levels.
Shorter timeframes are more relevant for scalping. They reflect current price changes. It is best to use them during important events, financial news releases, etc. However, it is important to consider that smaller time intervals have less accuracy. It is extremely difficult to determine the future direction of the price based on its changes in the last day alone. It is possible to make a profit on the 5M or 15M timeframe, but due to significant noise, achieving substantial gains can be challenging.
