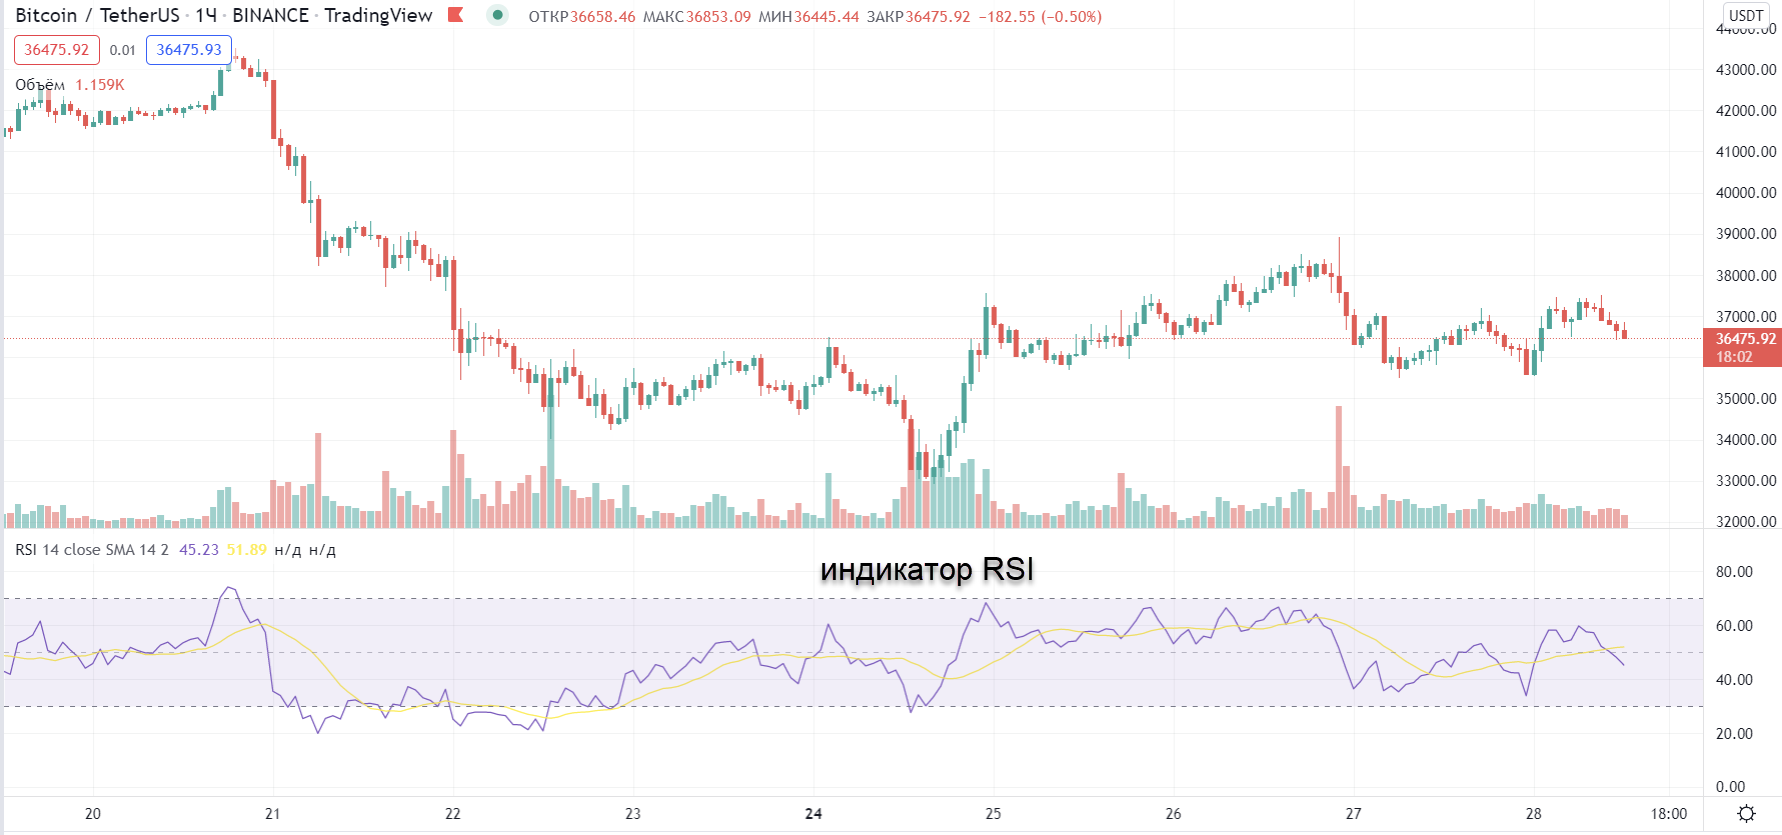
Relative Strength Index (RSI) – what is it?
By its nature, the indicator is an oscillator, in other words, a fluctuating indicator. The oscillator captures price movements and the speed of those movements. Simply put, RSI shows whether the price of a chosen cryptocurrency is in a strong or weak state. The indication is based on closing prices over a specific period, which positively affects the analysis efficiency.
Main indicators and criteria for using RSI:
- RSI value close to zero - downward price movement slows down;
- RSI value close to one hundred - upward price movement weakens more;
- RSI>70 - overbought instrument;
- RSI<30 - oversold;
- RSI=50 - middle or absence of a trend.
In addition, the oscillator helps identify a trend reversal in price movement. If the price is rising while RSI is falling - bearish divergence. If the price is falling while the oscillator is rising - bullish divergence.
For more information on trading with RSI, you can read this lesson in the free Crypto[START] course: 👉this lesson.