The Moving Average indicator: how to use it correctly in trading and how to configure it?
The moving average indicator is the most basic and widely used indicator. Its popularity is due to its simple interpretation of signals and solid mathematical and technical justification, which is confirmed by successful practical application.
The moving average indicator is an averaging filter that smoothes price fluctuations and provides a clearer understanding of the current and previous trends.
In this lesson of the Crypto[Start] course, I will talk about the different types of moving averages, how to configure this indicator, and how to interpret its signals.
Description of Moving Averages
The indicator under consideration is a line formed by points obtained by averaging the price according to a certain rule over a given time period, measured in bars (number of Japanese candlesticks) in the timeframe of the analyzed chart.
At first glance, the principle of forming a moving average may seem complex and unclear. To understand it, let me provide a couple of examples:
- Moving Average (MA) 20 on a 1-hour timeframe means that the moving average will be calculated based on the closing prices of the 20 nearest hourly candlesticks;
- MA 20 on a 1-day timeframe means that the average will be calculated based on the closing prices of the 20 nearest daily candlesticks.
In the example above, it is implied that the moving averages are calculated based on closing prices. However, calculations can also be based on opening prices, lows, or highs of the bars. I recommend using the default setting, which is to calculate based on closing prices.
Types of Moving Averages
Based on the applied formula, there are four types of moving averages.
Simple Moving Average
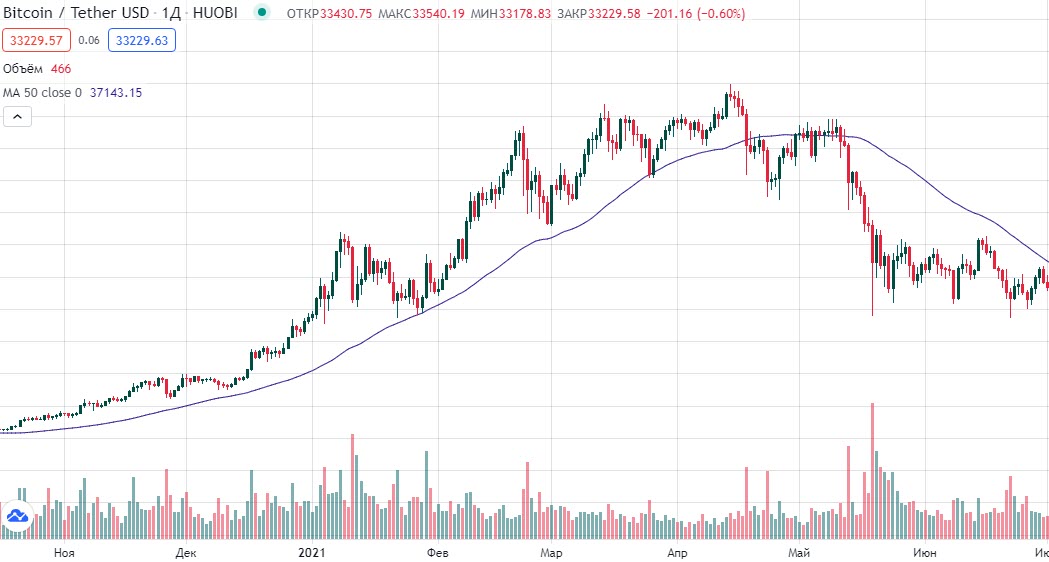

where n is the number of periods for the moving average, and Pi is the closing price of the i-th period (i = 1...n).
Weighted Moving Average
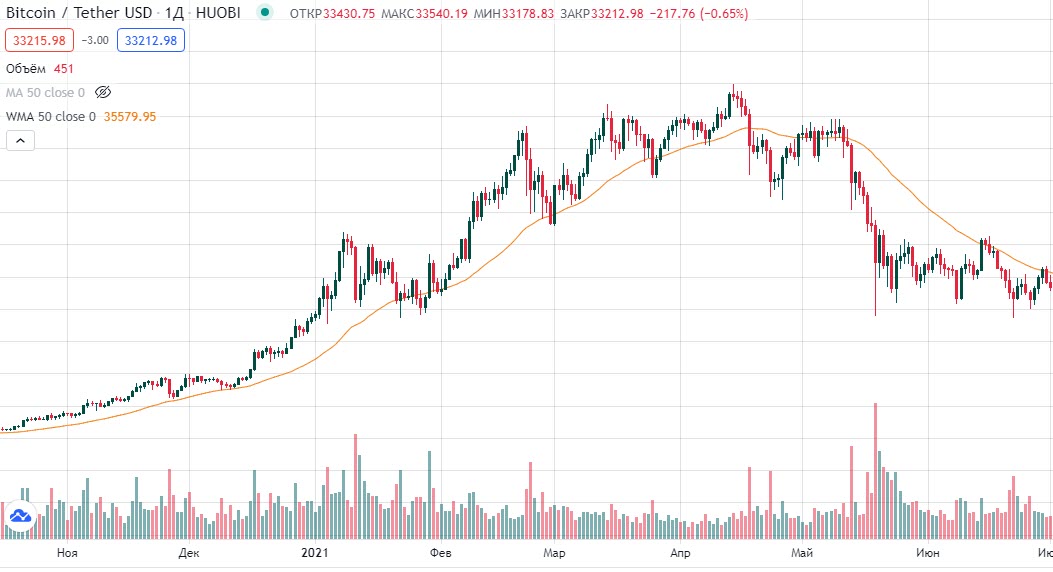
The formula for the weighted moving average (WMA) is as follows:
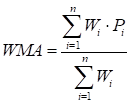
where Wi is the weight of the bar equal to 1/n, where n is its ordinal number.
Exponential Moving Average
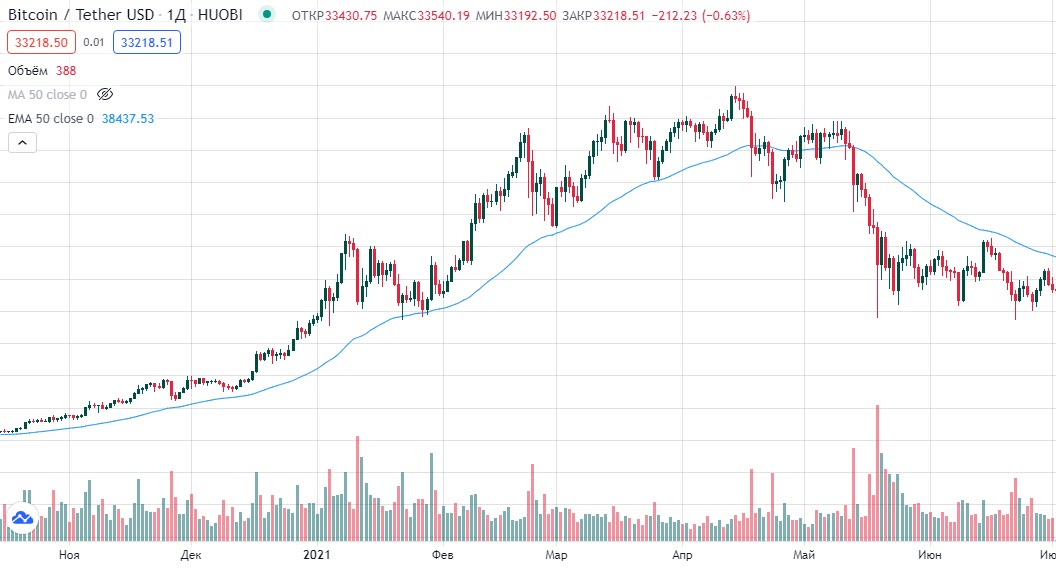
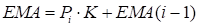
where pi is the current price, and K is the correction coefficient equal to 2/(n+1).
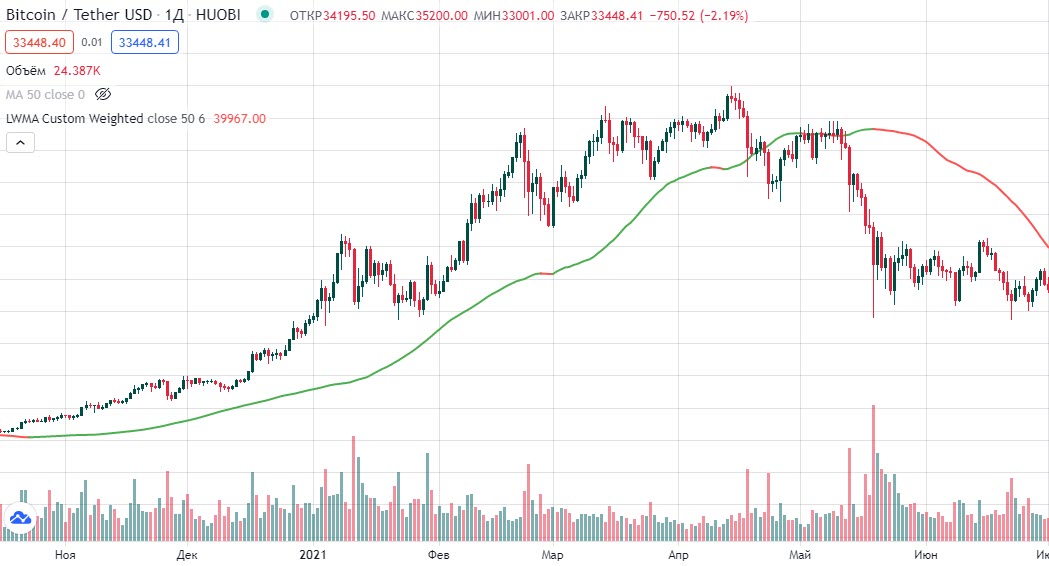
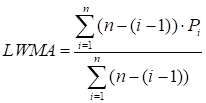
Linear Weighted Moving Average
Best Moving Average Settings
Simplicity is the key to successful trading. In the cryptocurrency market, there are very few charts with a long history. Therefore, I recommend using only two MAs with values of 50 and 200.
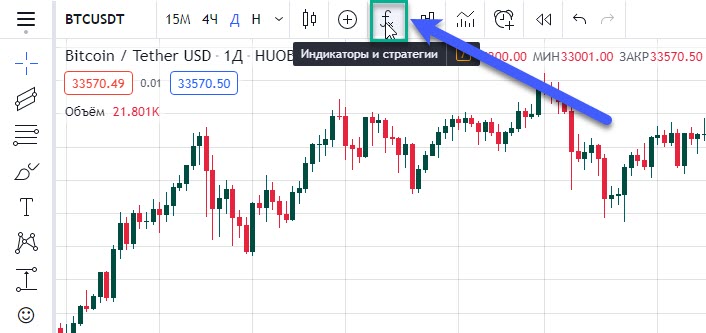
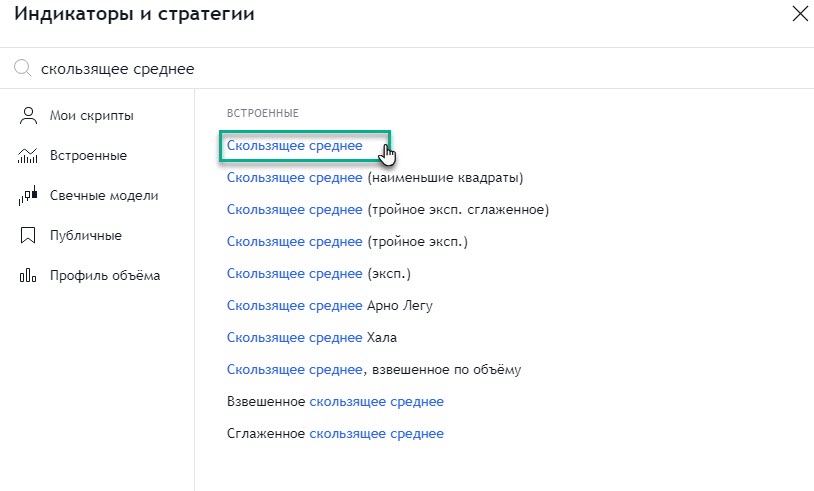
Setting up the moving average indicator in TradingView is simple. To do this, go to the Indicators section:
Enter the name of the indicator using keywords such as "MA" or "moving average" and select the official platform "plug-in":
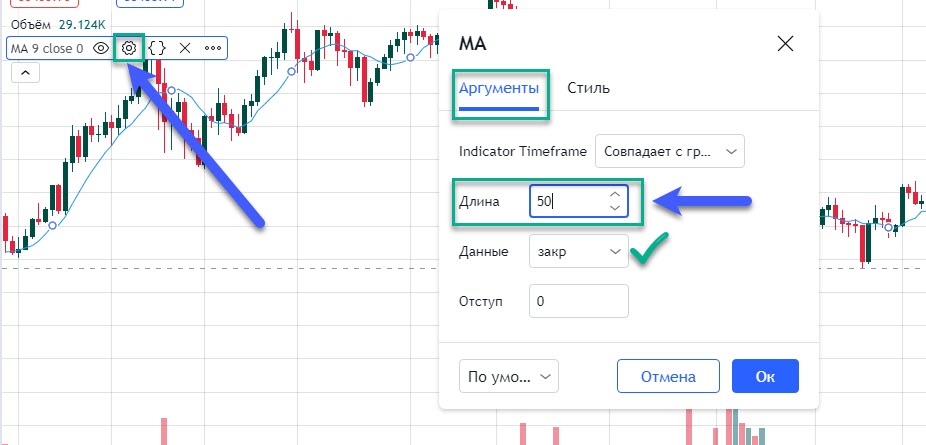
Then go to the settings of the moving average and specify its period in the "Length" section, as well as the calculation method:
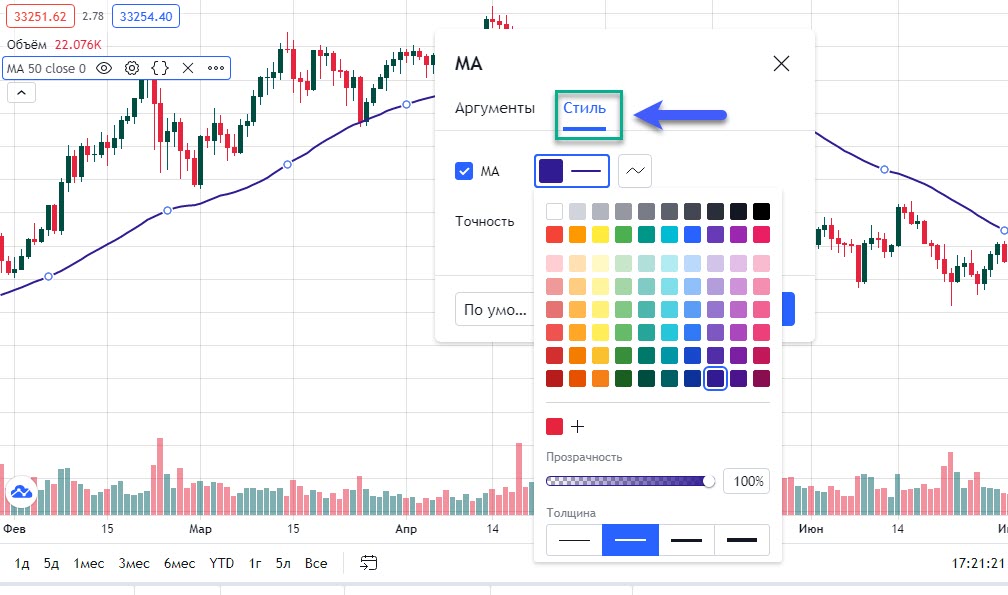
In addition to that, you can play around with the visual aspects of the indicator by choosing the desired color and line thickness:
To add each subsequent moving average with a period of 200, repeat the same steps described above.
Trading with Moving Averages
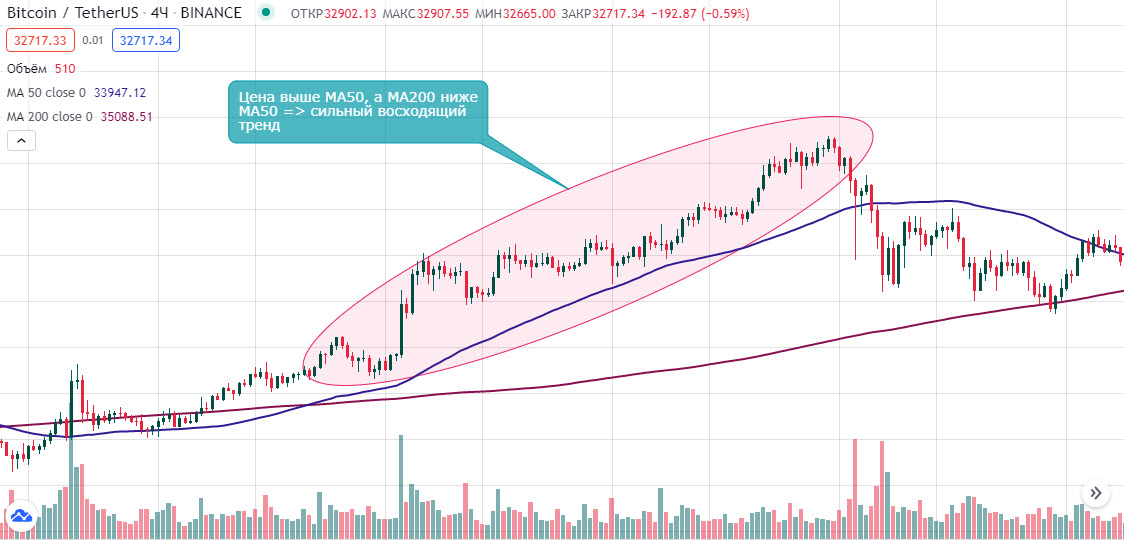
Moving averages are primarily used to determine the current trend:
- If the price is above the moving averages (MA50 and MA200), it indicates a strong uptrend;
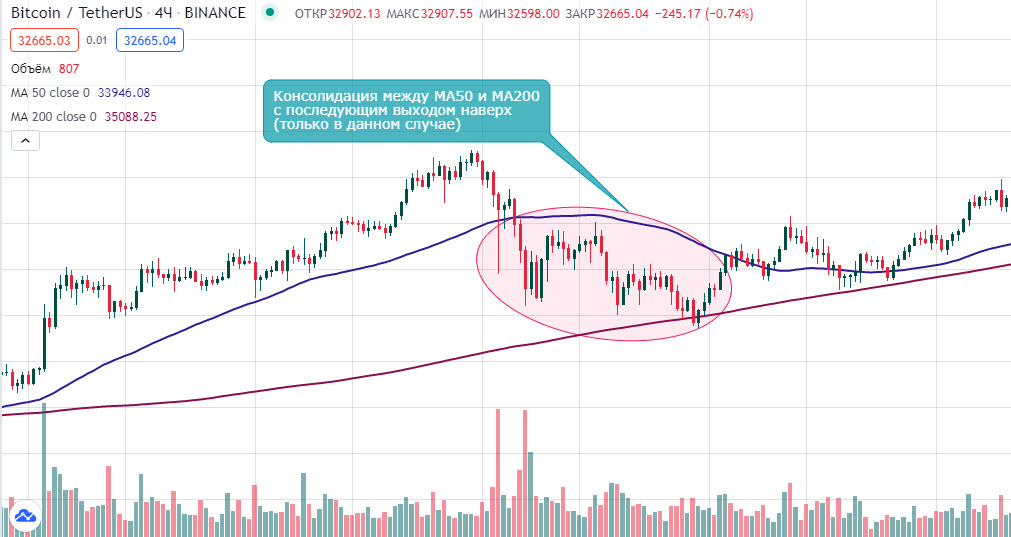
- If the price drops below the "smaller" moving average and stays above the "larger" one (i.e., between MA50 and MA200), it indicates a consolidation phase without a clearly defined direction;
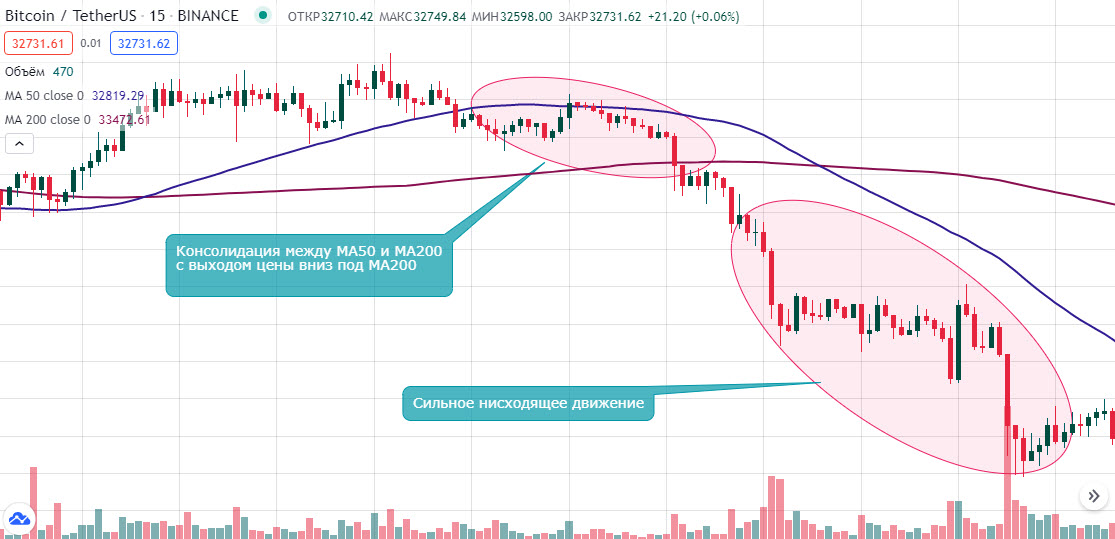
- If the price drops below the "largest" moving average (MA200), it indicates a strong downtrend.
You may also notice the intersection of moving averages on the charts, which signifies the following:
- The intersection of the "smaller" MA50 and the "larger" MA200 from bottom to top is a reversal signal indicating a shift from a downtrend to an uptrend;
- The intersection of the "smaller" MA50 and the "larger" MA200 from top to bottom leads to a reversal from an uptrend to a downtrend.
The terms "smaller" and "larger" moving averages are highlighted for a reason: the principles described above work for any type of moving averages with different periods. Therefore, you can easily change the formation principle of the average and test the implementation of the main analysis postulates to find the ideal indicator parameters that suit your trading style the best.
Thanks to the properties of moving averages, you can:
- Clearly characterize the current price movement;
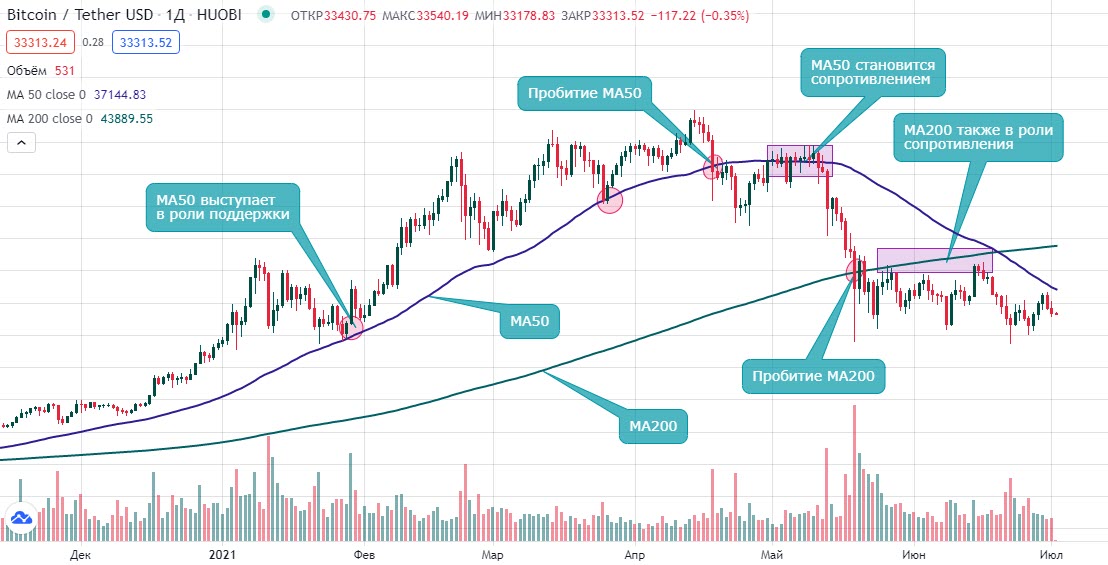
- Trade price bounces when approaching the moving averages;
- Identify position accumulation zones in the medium term;
- Be the first to spot market weakness and potential reversals.
Conclusion
Moving averages are one of the most important and fundamental trend indicators, and their application is highly reasonable. To summarize the lesson, several conclusions can be drawn:
- Moving averages are formed by averaging the closing price based on a certain mathematical rule;
- Their configuration involves determining the period and the calculation method;
- In cryptocurrency trading, it is advisable to use simple moving averages with periods of 50 and 200;
- If the price is above the moving averages, it indicates an uptrend;
- If the price is between the moving averages, it indicates a consolidation phase;
- If the price drops below the MA, it indicates a strong bearish movement;
- Moving averages can be considered as support and resistance lines with a high probability of being respected.