How to use the MACD indicator in trading? Application features!
Indicators significantly simplify a trader's life by providing a clear interpretation of scattered information. So let's continue our fascinating but important conversation about indicators. ;)
The MACD tool (abbreviation for Moving Average Convergence & Divergence) belongs to the category of trend indicators and is based on calculations using moving averages to determine their convergence and divergence.
It was developed in the 1970s by Gerald Appel, as well as Thomas Esprey, and has remained unchanged in its original form.
MACD Indicator Description
Multiple exponential moving averages with periods (also known as lengths) of 9, 12, and 26 are used to calculate the data.
The MACD line is formed by the difference between the slow EMA with a length of 26 and the fast EMA with a length of 12:
MACD line(i) = EMA_26(i) - EMA_12(i), where i is the candle's ordinal number.
To obtain the signal line, an exponential moving average with a length of 9 is taken from the MACD line itself:
Signal line(i) = EMA_9(from(MACD line(i)).
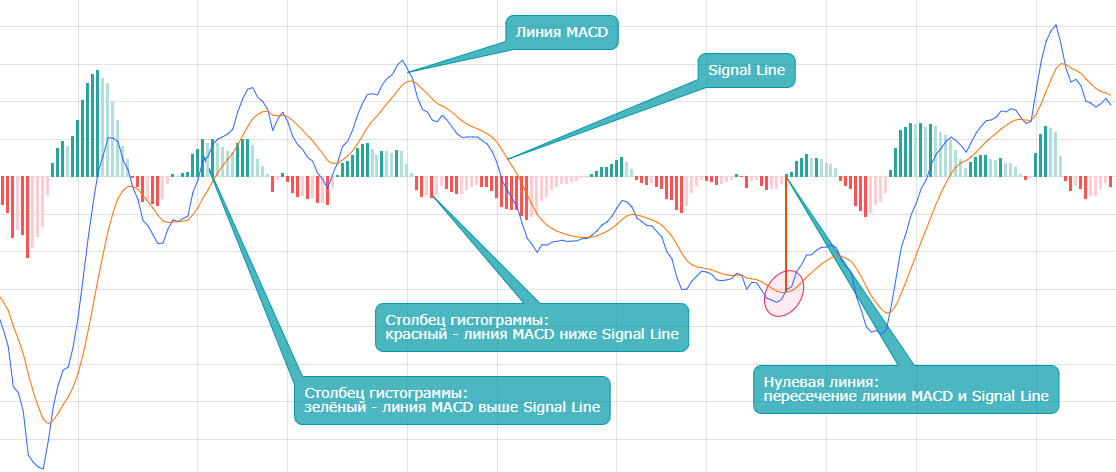
To facilitate the perception of the distance between the lines, a histogram was introduced, which shows the difference between the MACD line and the signal line.
MACD histogram(i) = MACD line(i) - Signal line(i).
As a result, if the indicator line is above the signal line, the histogram bar is colored green, indicating a positive difference. If the MACD line is below the signal line, the difference is negative, and the histogram column is colored red.
Proper MACD Setup in TradingView
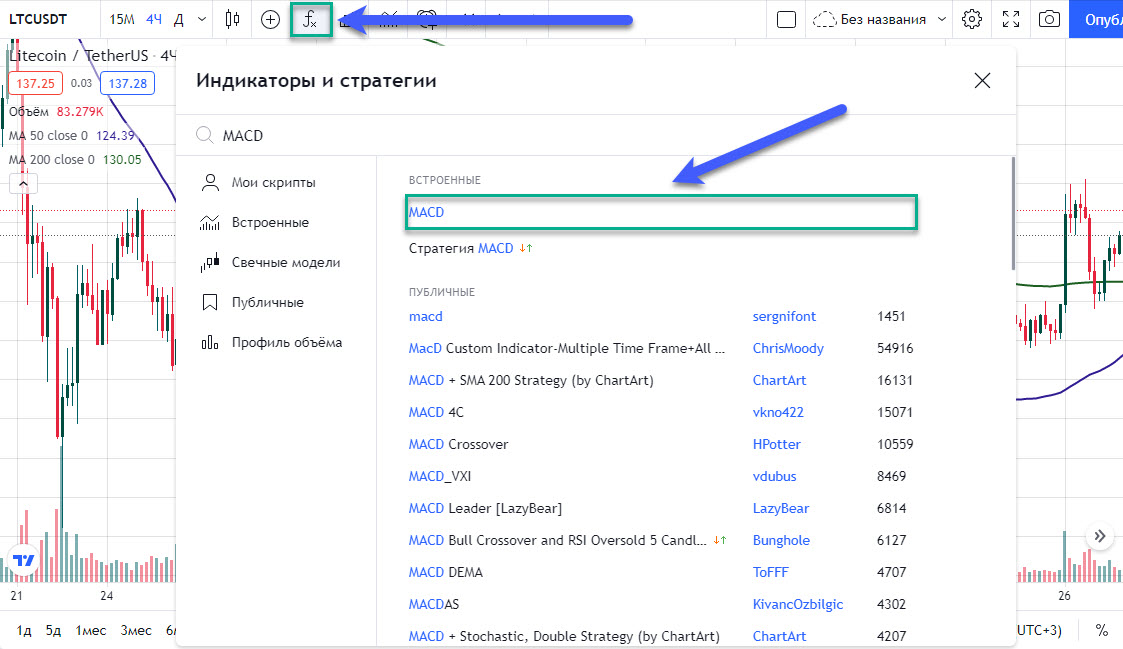
To enable the display of the MACD indicator on your chart, go to the "Indicators and Strategies" section and enter the keyword "MACD":
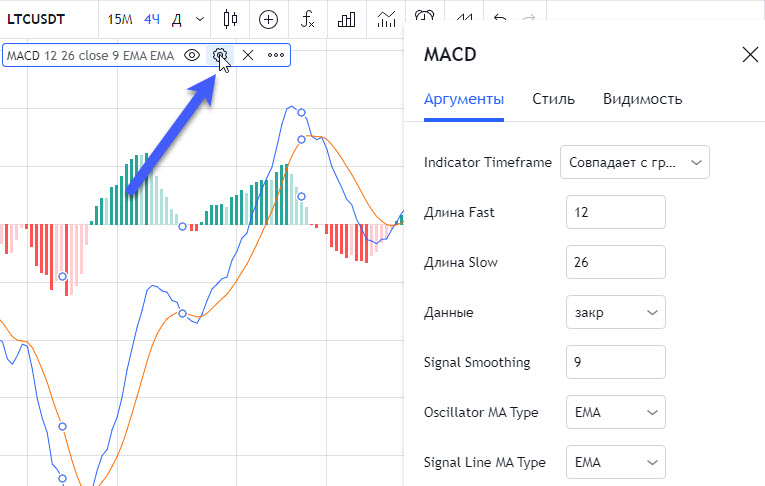
After adding the tool, you can view its main parameters:
- Indicator Timeframe - the price values of which timeframe will be used in the calculation. The default setting is "Coincides with chart." This means that, for example, for an hourly chart, moving averages for 1-hour candles will be used. If you want to use the averages of a specific timeframe on all charts, regardless of the candle formation time, you can choose the desired value in this field.
- Fast Length - the period of the fast moving average.
- Slow Length - similarly for the slow moving average.
- Data - refers to which price values will be taken from the candles to calculate the indicator's values. Usually, closing prices are always used.
- Signal Smoothing - the period of the average used to smooth the MACD line values.
- MA Line Types - indicates which types of moving averages are used.
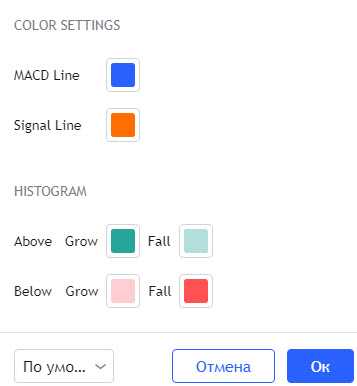
You can also change the colors of the lines according to your preference.
In general, finding the right values for the indicator's parameters is complex and requires careful analysis. If you want to determine your own parameters, you need to conduct observations on historical data as well as in real-time to assess the accuracy of the signals. However, the default parameters are widely accepted and used by most traders. Therefore, I recommend keeping them as they are. ;)
MACD Trading Strategy
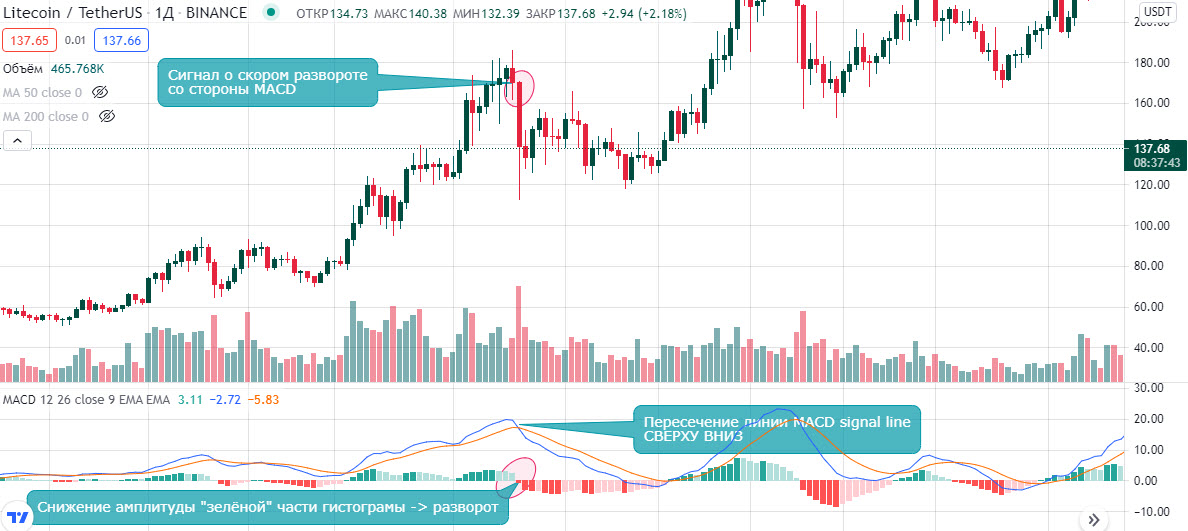
A gradual decrease in the amplitude of the histogram above the zero line indicates increasing selling pressure and thus represents an overbought zone.
Eventually, when the histogram column approaches the zero line, a reversal from an uptrend to a downtrend occurs, sometimes accompanied by a corrective rise.
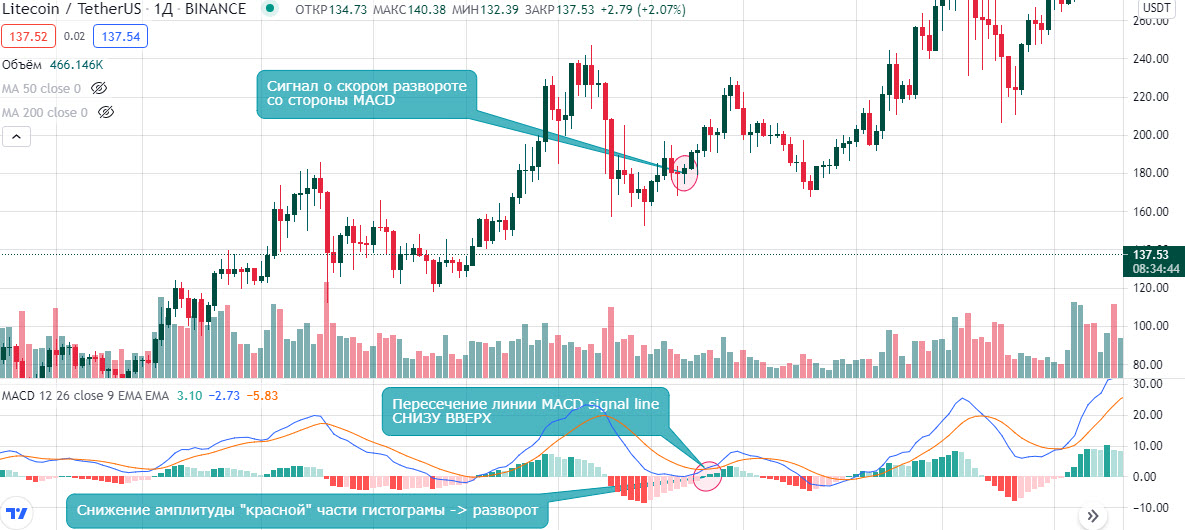
In the case where the histogram of the examined section is below the zero line, a decrease in its amplitude characterizes an oversold zone, indicating increased buying activity.
Similarly, if the "red" histogram column approaches the zero line, a potential reversal of a downtrend or a minor correction in the downtrend is imminent.
Therefore, based on the above, the following are signals of a trend reversal:
- A crossover of the MACD line and the signal line from top to bottom indicates a potential reversal from an uptrend to a downtrend, indicating that the asset should be sold.
- A crossover of the MACD line and the signal line from bottom to top indicates a potential reversal from a downtrend to an uptrend, indicating that the asset should be bought.
Divergence and convergence are explained in detail in this lesson.
Conclusion
Let's summarize a few key points:
- The MACD indicator is a trend-following indicator that uses exponential moving averages.
- The tool consists of a signal line, MACD line, and histogram.
- The histogram visually displays the difference between the lines, allowing you to assess overbought or oversold conditions at any given time.
- If the amplitude of the "red" part of the histogram decreases, you are in the oversold zone.
- If the amplitude of the "green" part of the histogram decreases, it indicates the overbought zone.
- A crossover of the MACD line and signal line from top to bottom implies a reversal from an uptrend and suggests an exit from long positions or the initiation of short positions (for risk-takers).
- When the MACD line crosses the signal line from top to bottom, a reversal from a downtrend occurs, indicating an exit from short positions or entry into long positions.