Secrets of divergence and convergence in trading: description and application!
The trader's task is not only to determine the current trend but also to have a tangible understanding of how long it will last and when its reversal will occur. Divergences and convergences help traders in this regard, which can be found using indicators such as MACD, RSI, or Stochastic. That is why we studied them in detail in the fourth module of the Crypto[START] training program.
Divergences in Trading
Divergence, derived from the English word "divergence," refers to the discrepancy between the direction of price highs and the indicator.
If you observe a gradual increase in price highs and a decrease in highs of the indicator's signal line, then you have identified a divergence.
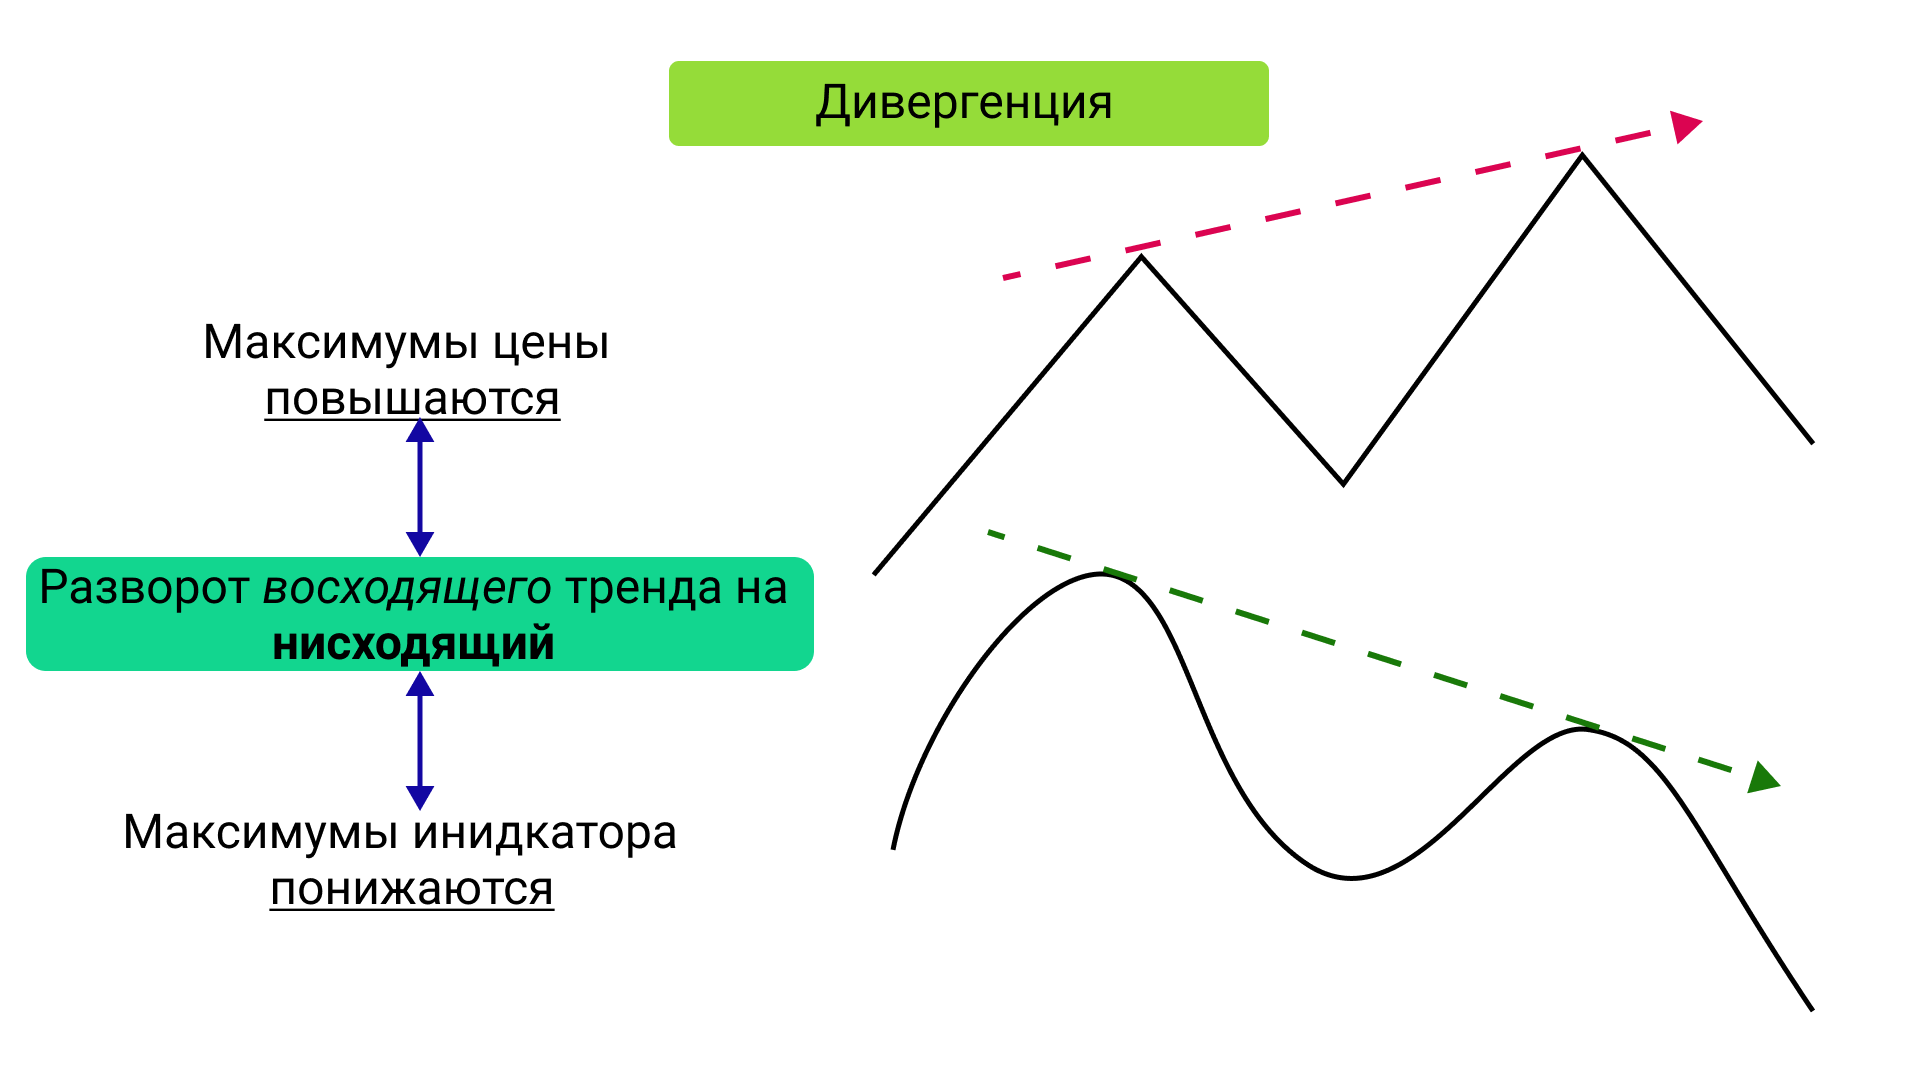
Classic divergence is informally referred to as bearish divergence because it symbolizes a significant increase in bearish activity and a decrease in bullish momentum.
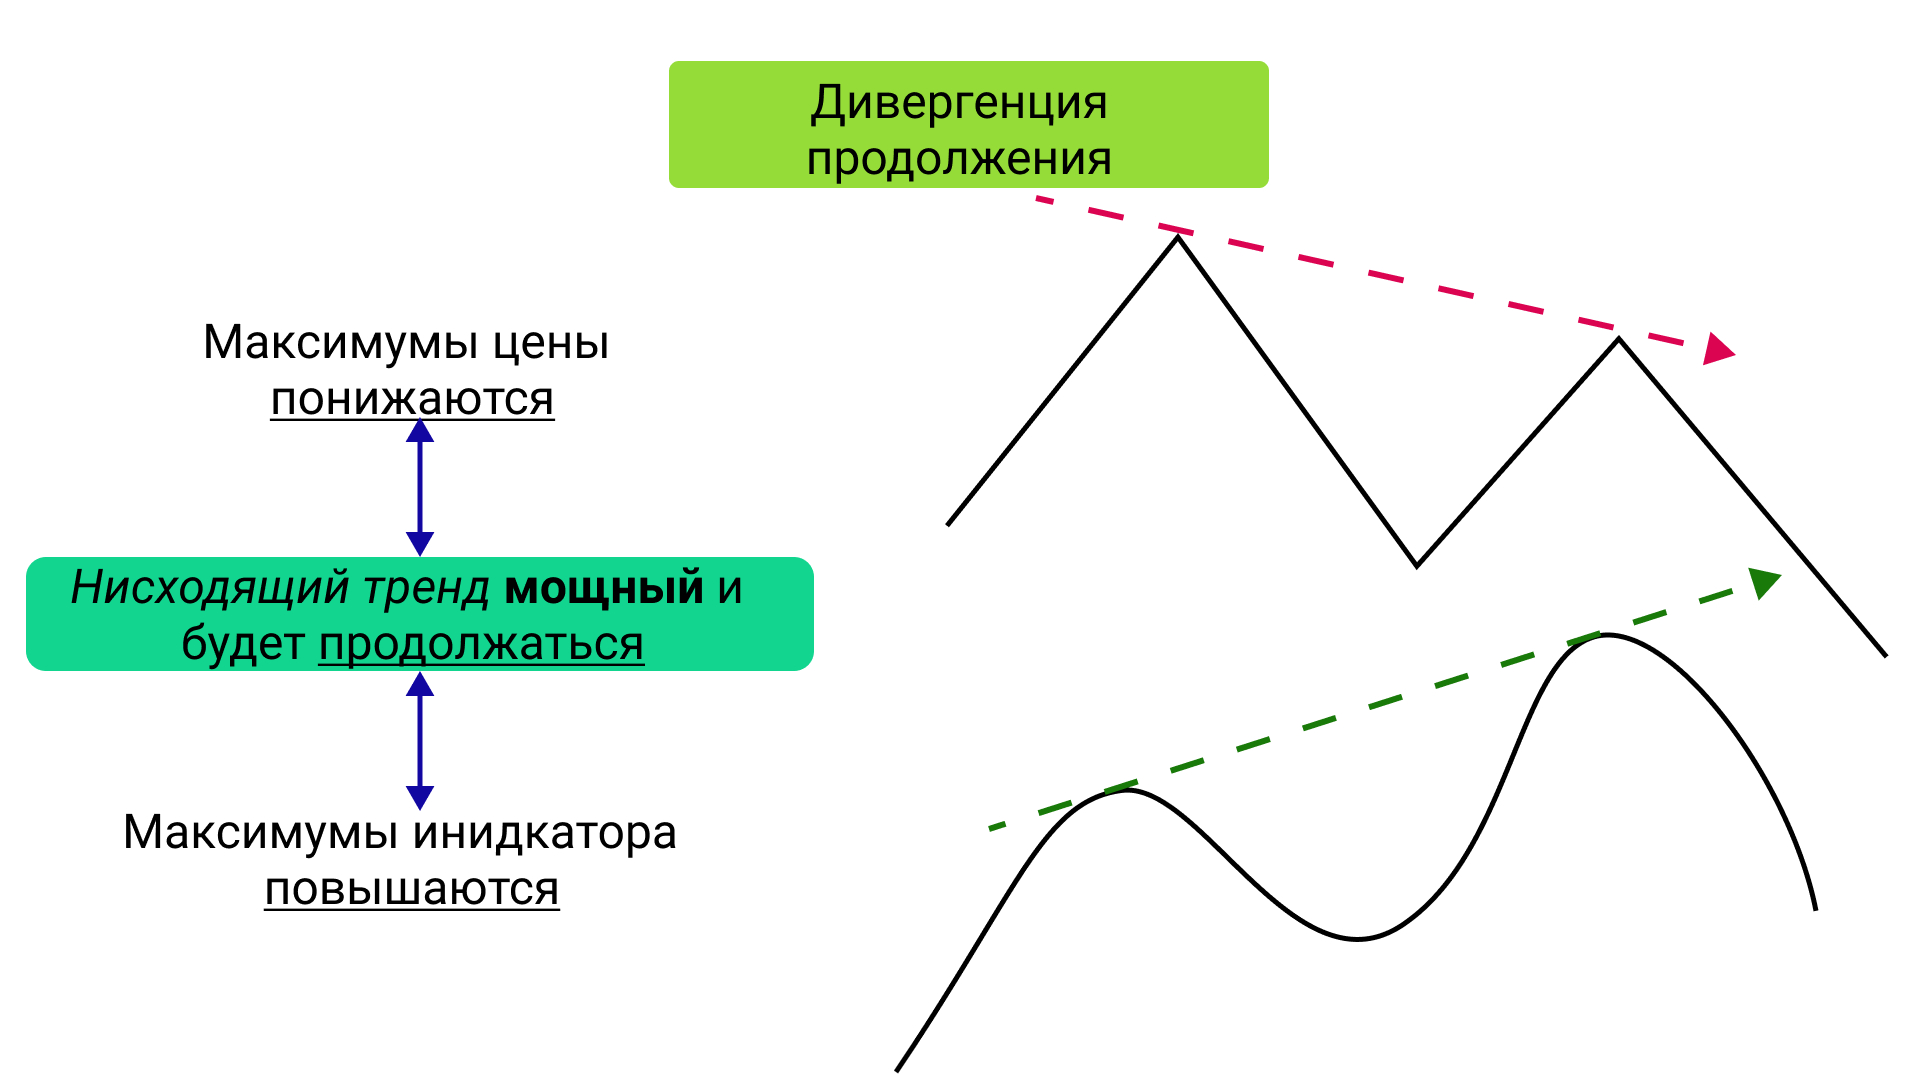
In addition to regular divergence, there is continuation divergence in a downtrend, which occurs when price highs decrease while indicator highs increase. The bears are so active that a trend reversal should not be expected in the near future.
Convergences in Trading
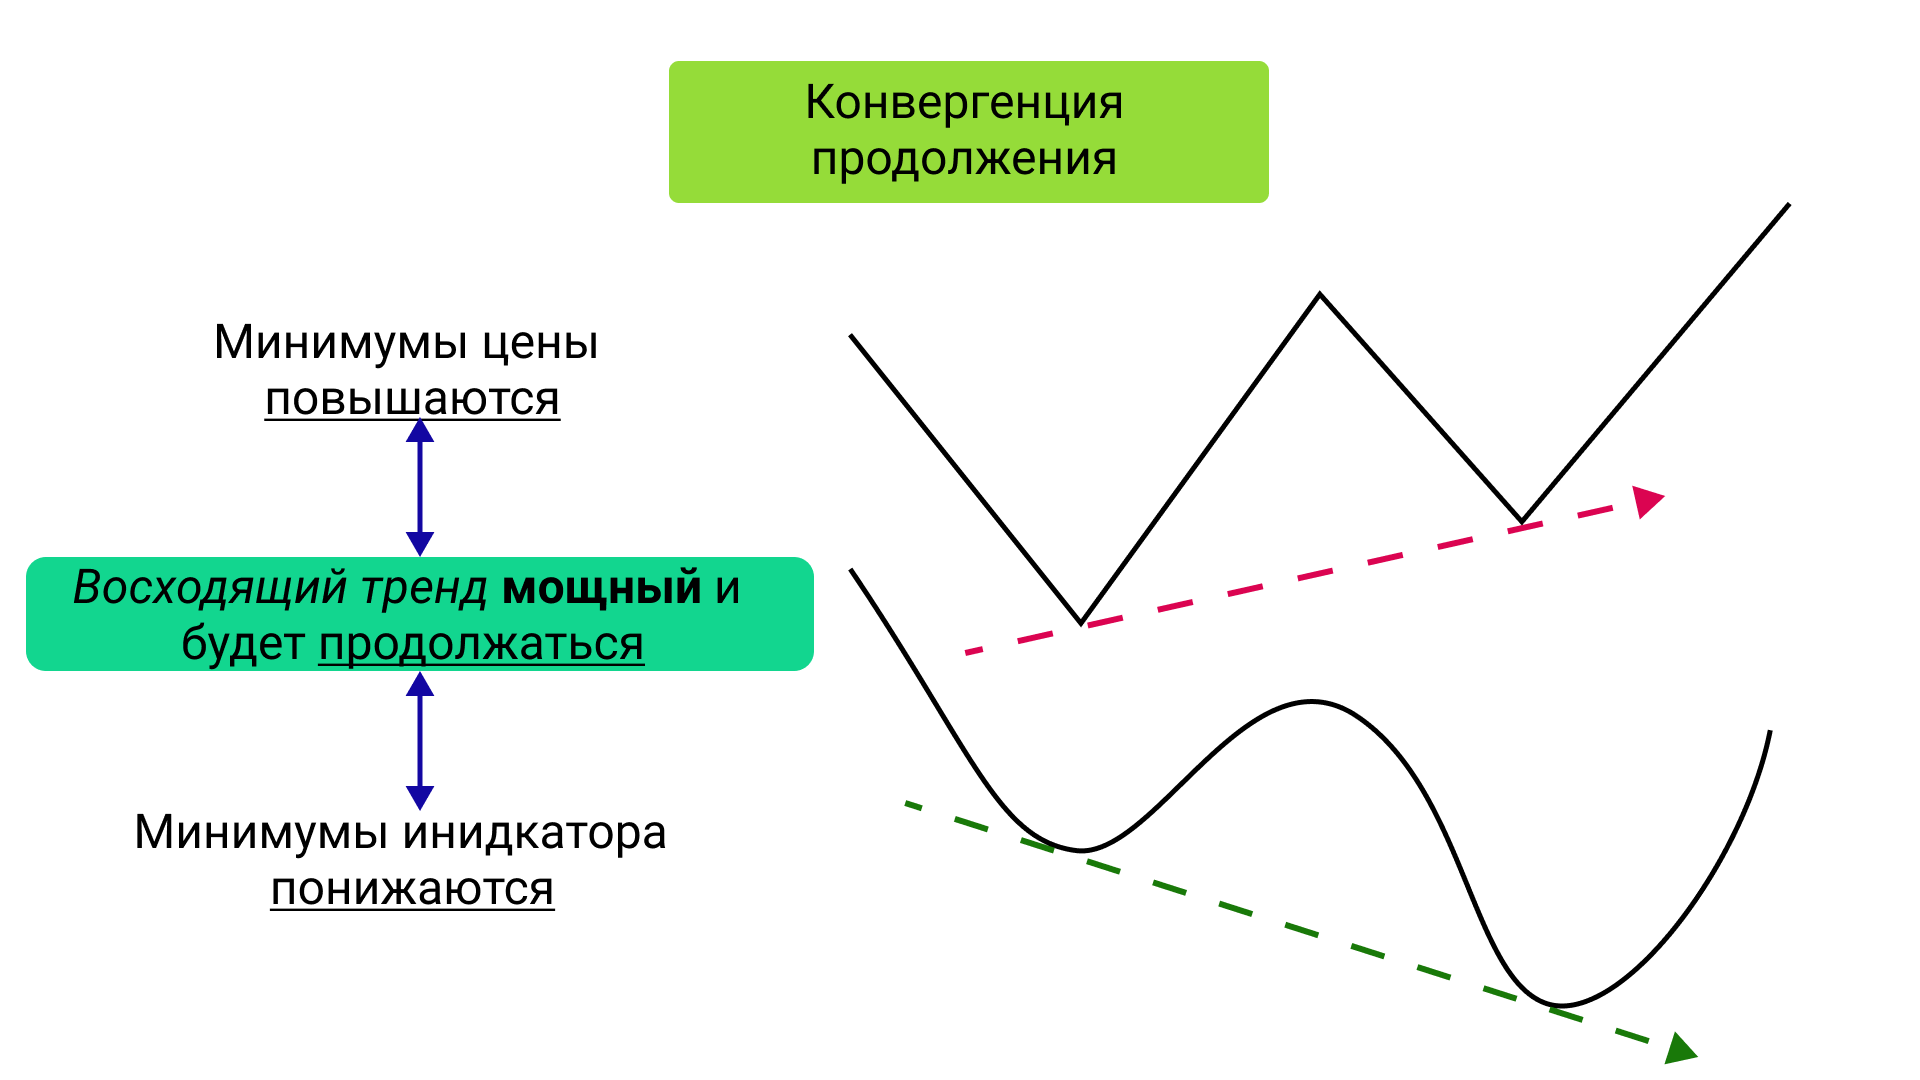
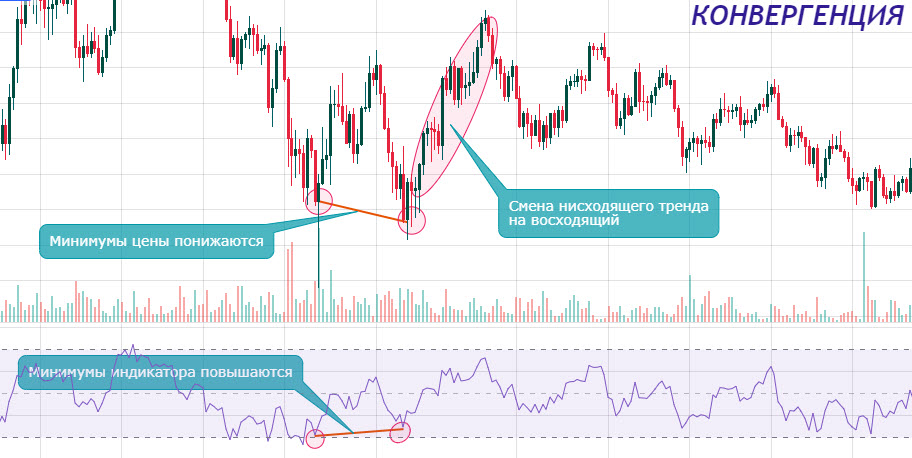
Convergence, derived from the English word "convergence," occurs when price lows decrease while indicator lows increase.

Convergence is also often referred to as bullish divergence because it signals a decrease in bearish activity and the beginning of bullish dominance. In general, these concepts are similar and equally valid.
There is also a concept called continuation convergence in the current trend. It occurs when price lows increase while indicator lows decrease. This indicates that the current uptrend is extremely strong and will continue in the future.
Trading with Divergences and Convergences
Use a combination of tools: look for confirmations of your actions based on divergences and convergences, but enter trades relying on additional trading methods. In crypto trading, it often doesn't make sense to trade "divs" and "cons" separately.
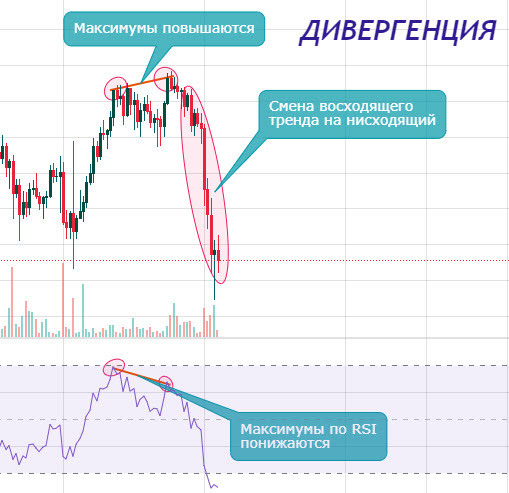
Let's consider the practical definition of divergences using the RSI indicator. As we can see, the price reached a new high, but the momentum was relatively weak, indicating a decrease in buying pressure and an increase in selling pressure. We observe the same pattern on the RSI indicator: despite the increase, we see that the indicator's highs are decreasing. This means we have a divergence and a potential reversal of the local uptrend to a downtrend. The conclusion is clear: we should close profitable trades, set tight stops for the remaining positions, and wait for new entry points.
Let's move on to the discussion of convergence. After a significant decline, there was a short-lived bounce followed by a reversal to the initial trend. However, sellers failed to push the price lower with strong momentum on high volumes, despite their almost successful attempt. As a result, we see that the lows on the RSI are increasing, which aligns with our theory of increasing bearish weakness. Therefore, we have a local convergence that can lead to a new upward impulse. We reduce shorts and look for opportunities to enter long positions.
Divergence and Convergence Indicator
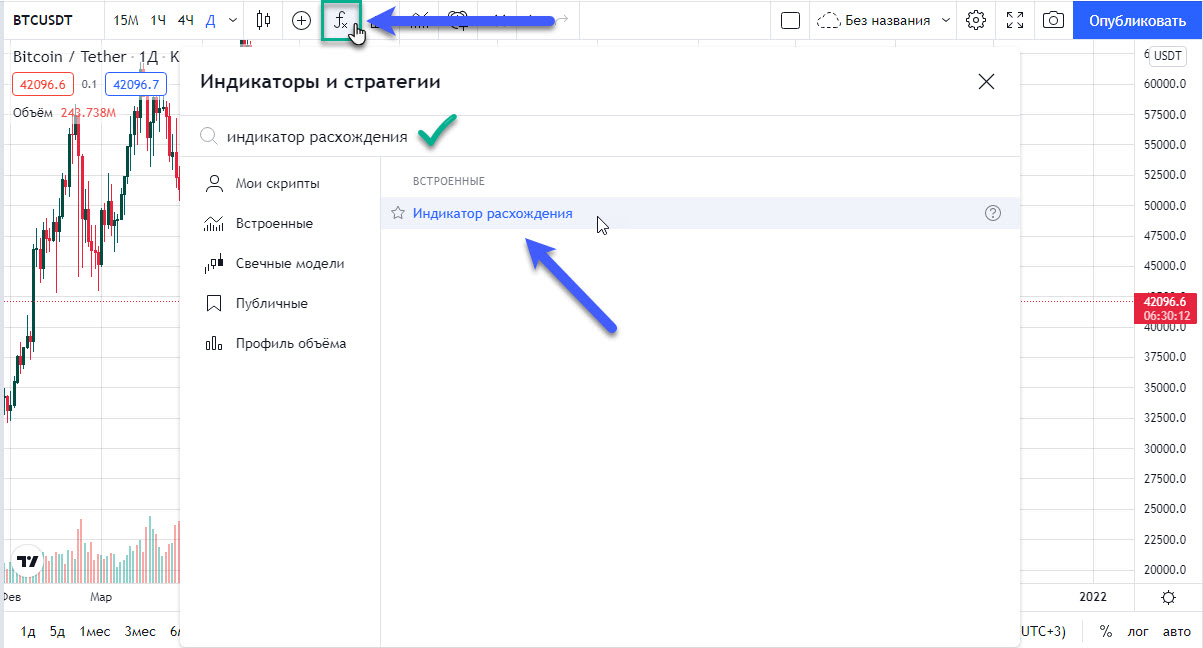
The Divergence and Convergence indicator can greatly simplify the search for divergences and convergences. To add the indicator, go to TradingView and enter the keyword "divergence indicator":
After enabling it, you will see a simple indicator that automatically marks divergences on the RSI with a 14-candle period on the selected timeframe:
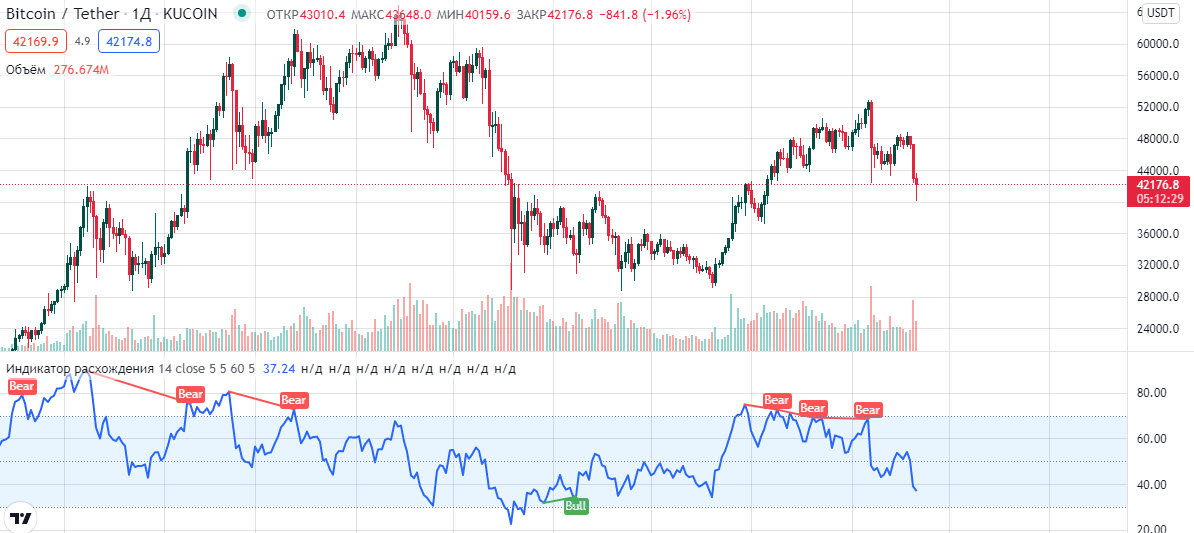
Very convenient and fast! :)
Conclusion
In conclusion, we can say the following:
- Divergence indicates a potential reversal from an uptrend to a downtrend, while convergence indicates a reversal from a downtrend to an uptrend.
- Divergence is identified by comparing price highs and indicator values (MACD, RSI, Stochastic), while convergence is identified by comparing price lows and indicator values.
- This tool allows you to easily identify potential "tension" zones that can lead to a change in the current trend.
- Continuation divergences/convergences are also recognized, indicating maximum strength in the current trend.
- For quick analysis, you can use the "divergence indicator," which automatically shows divergences. However, it's important to note that you may encounter false signals, so it's necessary to manually verify the identified formations for reliability.
- It is recommended to use this tool in conjunction with other technical analysis tools.