Stochastic indicator and oscillator: how to use it correctly in trading?
The Stochastic indicator is an oscillator that fluctuates within a certain range, expressed as a percentage. Stochastic is used by many traders to identify overbought and oversold zones, as well as to generate signals for position accumulation or reduction.
In general, the principle of Stochastic is not much different from MACD or RSI. The most important thing to remember is that they are all based on moving averages MA and use previous price values over a selected period in their calculations. Therefore, by knowing how to analyze moving averages correctly, you can easily interpret signals from other tools.
Description of the Stochastic Indicator
The Stochastic indicator was created and popularized by trader, investor, and analyst George Lane, who wanted to develop a universal tool for determining the characteristics of the current price momentum.
Lane's main idea, which he incorporated into Stochastic, was to obtain the ratio of the difference between the previous price and the minimum price over a period to the difference between the maximum and minimum price over the same period, expressed as a percentage:
%K(i) = ([C(i-1) - min(Ln)]/[max(Hn)-min(Ln)])*100%, where
%K(i) - the value of the unsmoothed Stochastic line in the i-th period;
C(i-1) - the closing price of the previous candle;
min(Ln) - the minimum price over n periods;
max(Hn) - the maximum price over n periods.
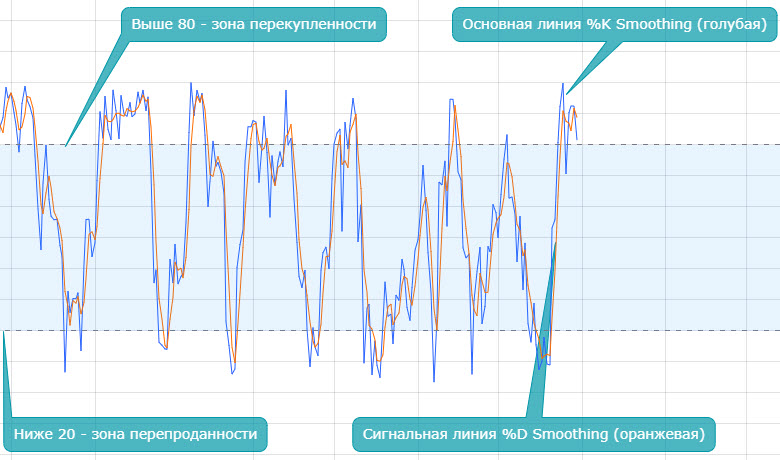
The %K line needs to be smoothed with a small period moving average to eliminate sharp fluctuations. As a result, the %K Smoothing line is obtained, which is called the main Stochastic line. Then, %K is smoothed again with a larger period moving average to generate the second line, %D Smoothing, which serves as the signal line of the indicator.
As a result, the classic Stochastic consists of:
- the main %K Smoothing line;
- the signal %D Smoothing line;
- the confidence range: overbought and oversold zones.
Proper Settings
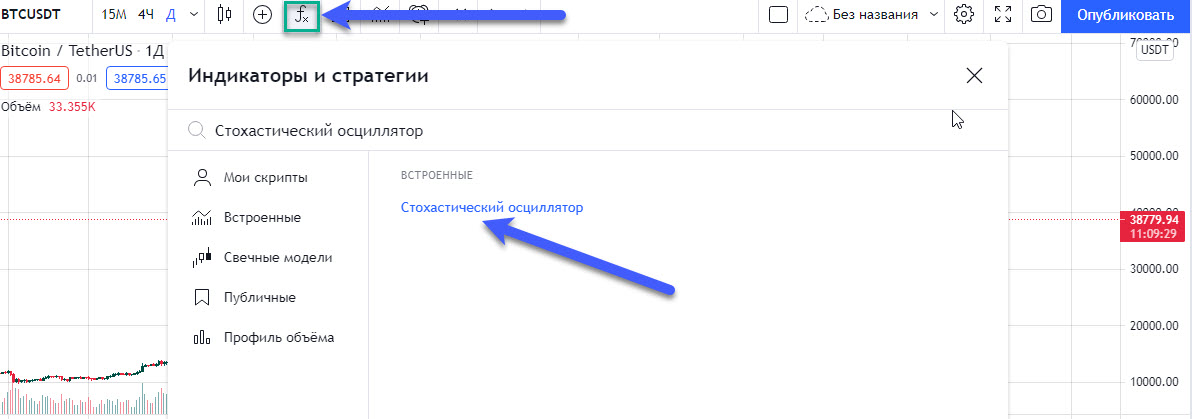
To add the Stochastic indicator to your chart, go to the "Indicators and Strategies" section and enter the keyword "Stochastic Oscillator":
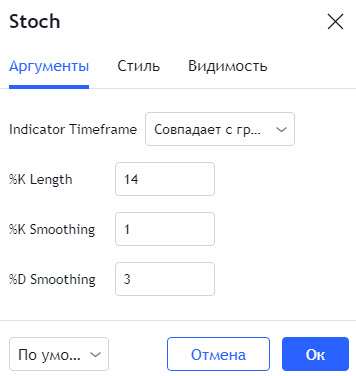
As always, you can customize not only the style of the oscillator but also its main parameters, which are set by default as 14 / 1 / 3:
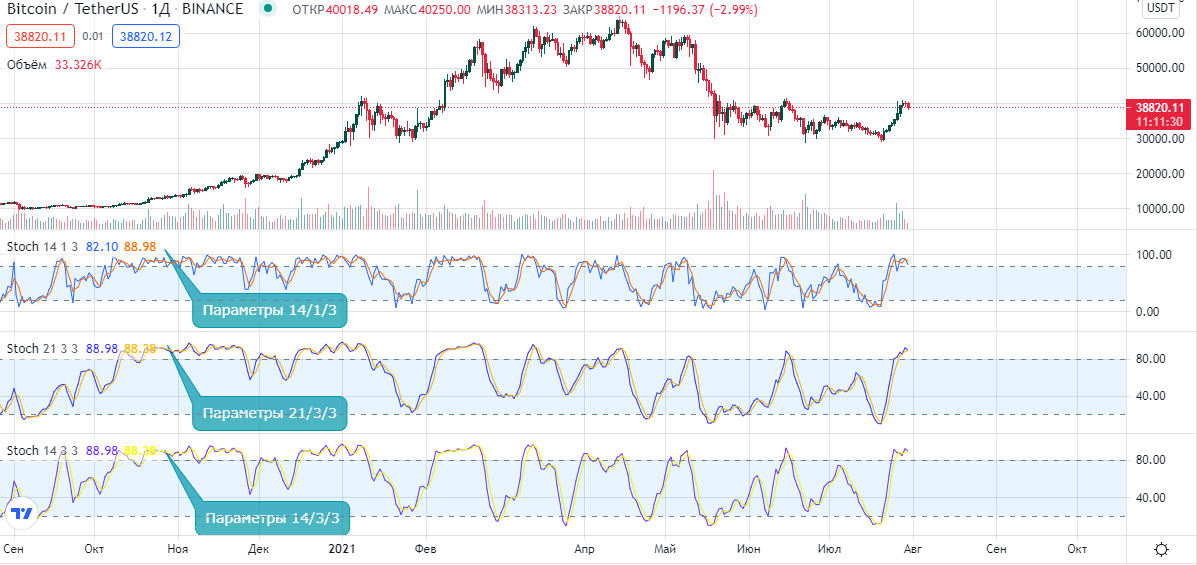
When selecting parameters that are suitable for your trading, consider the following:
- Increasing the period of the Stochastic line reduces the number of its bends, which increases the accuracy of signals. It is recommended not to use a period larger than 21.
- Increasing the period of the moving averages used to smooth the main and signal lines of the Stochastic oscillator ensures their smoothness and reduces the number of false boundary breaches in the confidence range.
How to Use Stochastic?
When the Stochastic lines exceed the 80% confidence level , it indicates that the price is in the overbought zone. The oversold zone is characterized by the lines falling below the 20% level.
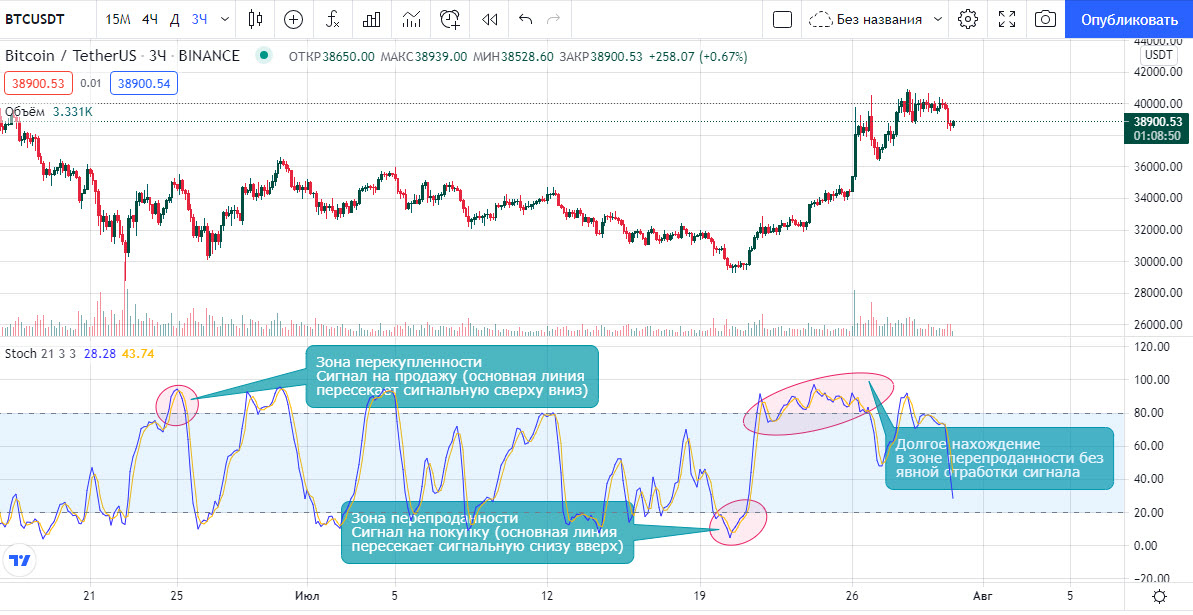
It is worth noting that in the case of strong trends, the Stochastic lines can stay outside the confidence levels for a long time. Therefore, for a strong uptrend, the levels are set to 10 / 90, and for a downtrend, they are set to 30 / 70.
The crossing of the main line with the signal line from below upwards can be interpreted as a signal to accumulate a long position, and from above downwards as a signal to reduce a long position or accumulate a short position. However, in practice, Stochastic lines often cross and intertwine in various ways.
Conclusion
In general, the Stochastic oscillator is not much different from its counterparts in the "craft." To use it correctly, keep in mind the following:
- Stochastic is used during sideways movements to identify overbought/oversold zones and anticipate subsequent reversals.
- This indicator cannot be the sole basis for making trading decisions.
- The recommended parameters are 21 / 3 / 3 or 14 / 3 / 3, where the first number represents the number of periods for calculating the unsmoothed Stochastic line, the second number is the smoothing period for the main line, and the third number is the smoothing period for the signal line.
- If the oscillator lines exceed the 80 level, the price is in the overbought zone.
- If the oscillator lines fall below the 20 level, the price is in the oversold zone.
- Parameters 20 / 80 are commonly used for the confidence range in flat market conditions. For a strong uptrend, the range is often expanded to 10 / 90, while for a downtrend, it is narrowed to 30 / 70.